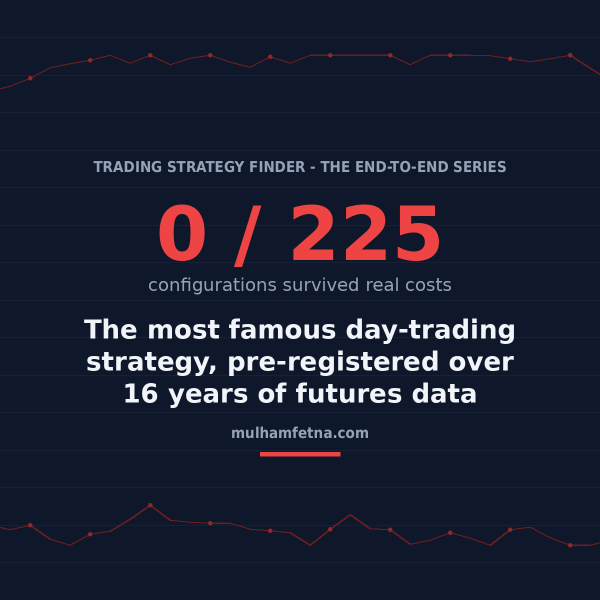
We tested the most famous day-trading strategy on 16 years of data. Zero of 225 versions survived real costs.
If you’ve ever watched a trading tutorial, you’ve met the opening-range breakout: mark the high and low of the first minutes of the session, and trade the breakout when price escapes that range. It’s simple, mechanical, and everywhere — and recent academic papers report spectacular returns for it on stocks.
We wanted to know: does it actually work on futures — the markets we research — once you pay real-world trading costs?
How we made it impossible to fool ourselves # The problem with backtests is that the person running them controls everything: which variants get tried, which costs get assumed, which results get shown. Try enough variants and something will always look great by accident.
So before computing a single profit number, we pre-registered the entire experiment in our public repository: nine futures markets (Nasdaq, S&P, Russell, Dow, gold, silver, copper, crude oil, natural gas), two session anchors, four range lengths (5/15/30/60 minutes), three exit rules taken verbatim from the literature, plus a published comparator rule — 225 configurations, zero tunable parameters, verdict thresholds and controls fixed in advance. Sixteen years of one-minute data (2010–2026). One contract per trade. Costs stressed at $25 per round trip. No configuration could be added, removed, or “fixed” after seeing results.