
If you’ve ever watched a trading tutorial, you’ve met the opening-range breakout: mark the high and low of the first minutes of the session, and trade the breakout when price escapes that range. It’s simple, mechanical, and everywhere — and recent academic papers report spectacular returns for it on stocks.
We wanted to know: does it actually work on futures — the markets we research — once you pay real-world trading costs?
How we made it impossible to fool ourselves #
The problem with backtests is that the person running them controls everything: which variants get tried, which costs get assumed, which results get shown. Try enough variants and something will always look great by accident.
So before computing a single profit number, we pre-registered the entire experiment in our public repository: nine futures markets (Nasdaq, S&P, Russell, Dow, gold, silver, copper, crude oil, natural gas), two session anchors, four range lengths (5/15/30/60 minutes), three exit rules taken verbatim from the literature, plus a published comparator rule — 225 configurations, zero tunable parameters, verdict thresholds and controls fixed in advance. Sixteen years of one-minute data (2010–2026). One contract per trade. Costs stressed at $25 per round trip. No configuration could be added, removed, or “fixed” after seeing results.
flowchart LR
    A["9 futures markets
NQ · ES · RTY · YM
GC · SI · HG · CL · NG"] --> G["225
pre-registered
configurations"]
    B["2 session anchors
cash open · Globex open"] --> G
    C["4 range lengths
5 / 15 / 30 / 60 minutes"] --> G
    D["3 exit rules from the literature
+ a published comparator"] --> G
    G --> E["🔒 grid, thresholds and controls
frozen before any P&L existed"]
What happened #
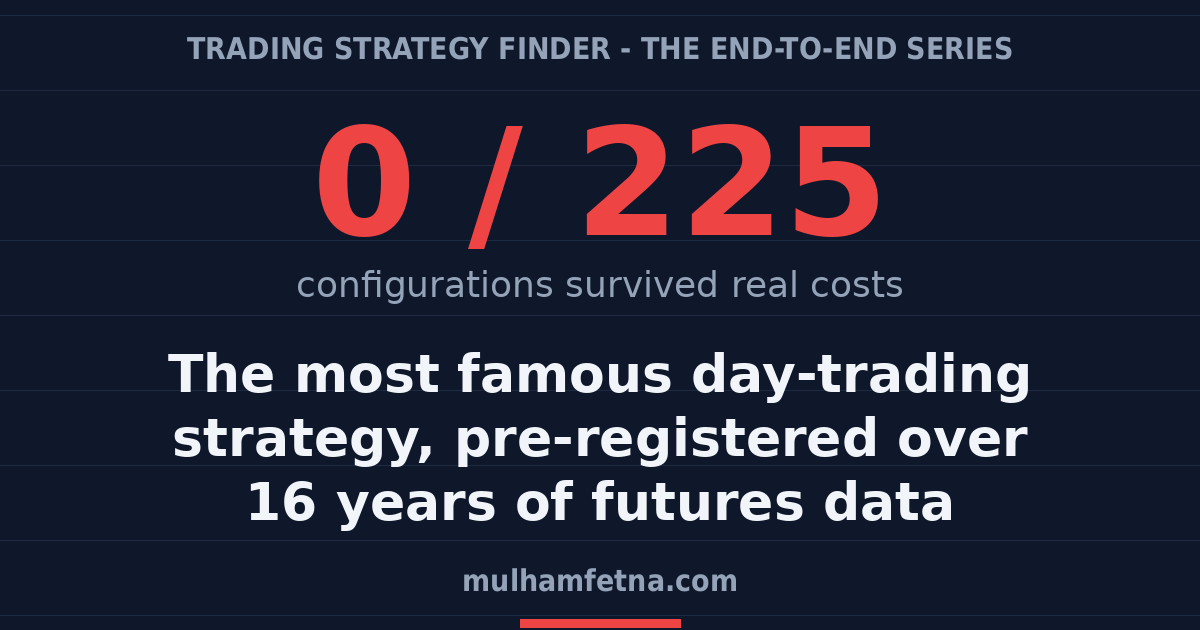
- Zero of 225 configurations met the pre-registered bar for a positive result.
- Before costs, the grid actually earned +$1.57M on the confirmation window. After $25 per round trip: −$6.49M. The strategy’s entire apparent edge lives inside the spread.
- The median configuration’s gross edge was −0.01 ticks per trade.
- 28 configurations were negative with statistical power — meaning the test could have detected a cost-sized edge, and instead saw a loss.
- The 5-minute opening range — the literature’s favourite — was the worst window of the four.
- The single best-earning configuration failed our random-anchor control: ranges anchored at random hours of the day earned just as much. Whatever it was trading, it wasn’t “the open.”
Full study, with every number re-derivable: https://papers.ssrn.com/sol3/papers.cfm?abstract_id=7428398.
The part we care about most #
Any of those 225 cells, presented alone with optimistic costs, would have made a convincing strategy pitch. That’s the real finding — not about breakouts, about method.
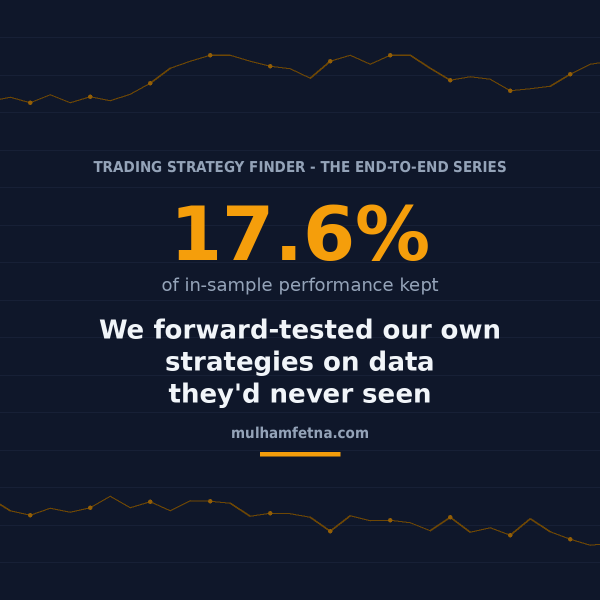
Our research programme runs on a rule we’d recommend to anyone in this field: every published number is a machine-verified claim. Each one is bound to the evidence files that produced it, carries three independent verifications (one designed to falsify it) and a declared blind spot, and our CI re-derives all 79 of them — offline, in minutes, with no market data — on every change. Even our own deployed strategies got the same treatment: on genuinely fresh data they kept only 17.6% of their in-sample performance, and we published that too. The methodology paper is here: https://papers.ssrn.com/sol3/papers.cfm?abstract_id=7428478.
Everything is open: github.com/mulhamfetna/trading-strategy-finder (archived releases: DOI 10.5281/zenodo.21473312). The market data are commercially licensed so they’re not in the repo — but you don’t need them to check us: the verification harness replays every published claim from committed evidence, and the whole pipeline runs on any data feed you connect.
The broader story of the project starts here: the end-to-end overview.
This research was carried out at BeInMedia (Nmo AI), Kuwait • Dubai • Doha.