
  1. Projects/
  2. Trading Strategy Finder — 16 Years of Futures Data, Honestly Tested/

Every number we publish is machine-verified. Here's the machinery

Mulham Fetna
Author
Mulham Fetna
Renaissance Engineer
Table of Contents
Trading Strategy Finder - This article is part of a series.
Part 5: This Article

The hardest problem in trading research isn’t statistics — it’s that the researcher grades their own homework. You choose what to try, what costs to assume, when to stop, and what to show. After three and a half months of running a research programme under that temptation, we’re convinced the only defense that holds is mechanical: make it impossible to publish a number that doesn’t re-derive from evidence.

This post describes the system we built and now run everything through. The full methodology paper is at https://papers.ssrn.com/sol3/papers.cfm?abstract_id=7428478; the code is public.

A claim is an object, not a sentence
#

In our repository, a published number isn’t prose — it’s a registered object with required fields: the statement with its numbers inline; the evidence files that produced it (committed to git — a claim whose evidence isn’t version-controlled is rejected structurally); an executable re-derivation compared to the published value within an explicit tolerance; three independent verifications that must fail for different reasons, one of which is a falsifier — a test built so that a specific way of being wrong would trip it; and a mandatory declared blind spot, because “verified, with no stated limitation” is itself a defect.

flowchart TB
    C["📄 One published claim"] --> S["the statement,
numbers inline"] C --> EV["evidence files —
must be git-tracked
(untracked ⇒ rejected structurally)"] C --> R["executable re-derivation
must equal the published value
within an explicit tolerance"] C --> V["three verifications that
must fail for DIFFERENT reasons"] V --> F["one is a falsifier — built so a
specific way of being wrong
would trip it"] C --> B["mandatory declared blind spot
('verified, with no stated
limitation' is itself a defect)"]

All 79 current claims replay offline in minutes with no market data, and CI runs them on every change: break a published number and the build goes red.

The gate that distrusts itself
#

A verification gate that has never failed is untested. So the ledger ships a self-test that replays five real mistakes from our own history — reconstructed exactly as originally published — and requires the harness to reject every one: a figure checked against notes instead of its producing artifact; a true statement about one data series silently generalized to 649; a “verified” claim with nothing that could have come out false; a retracted result reused without its retraction marker; an absolute stop that was silently a different percentage on every instrument.

And the self-test’s own origin story is the best argument for it: on its first run, two replays were “correctly rejected” — by a file-path crash, not by the defect. Green for the wrong reason is the same disease one level up. It now demands each rejection match the specific expected failure.

flowchart LR
    P["any push or pull request"] --> CI["CI replays all 79 claims
offline · minutes · no market data"] CI -->|"every number re-derives"| G["✅ build green"] CI -->|"one number off"| R["❌ build red —
the repo refuses to publish it"] ST["self-test: 5 real historical mistakes,
reconstructed as originally published"] --> Q{"does the harness
reject each one?"} Q -->|"rejected for the RIGHT reason"| OK["✅ the gate is certified"] Q -->|"rejected by a crash or
for the wrong reason"| BAD["❌ self-test fails —
green for the wrong reason
is the same disease"]

Two episodes where the machinery overruled us
#

The +$260k that wasn’t. A re-optimization improved its training window by +$260,346. On the 2026 holdout the challengers collapsed — and then our first measurement of that collapse was itself retracted the same day: the holdout was out-of-sample for the challenger but in-sample for the incumbent. Asymmetric comparison, worthless number. What survived was baseline-independent: six of twelve re-optimized challengers lost money outright on data they’d never seen; zero of twelve improved it. Nothing was adopted, and “out-of-sample must be out-of-sample for both sides” is now a standing rule.

The 8-of-8 that became 5-of-8. A search variant beat its control in eight of eight seeded runs, median +55%. On eight fresh seeds — same pre-declared criterion — it won five of eight at −4% median. Two runs agreeing on the same seeds had felt like corroboration; it was the same eight dice rolls counted twice. Fresh-seed replication is now a pre-registration requirement.

The rest of the discipline, in one paragraph
#

No study runs without a pre-registration filed first; changes mid-run are dated, append-only amendments stating what was known at filing time. No negative verdict without a power analysis (an under-powered “didn’t work” is labelled no verdict, never proven absent). No positive without a dumb control and a bootstrap noise check. Costs lead every table. And failed campaigns stay in the database under their own names — prefixes are never reused, so the graveyard is part of the record.

None of this is expensive. The 225-cell study computed in 90 seconds; the discipline around it is organizational, not computational. If you do quantitative research of any kind — not just trading — the pattern transfers whole: github.com/mulhamfetna/trading-strategy-finder.

Final post — freezing a track record so it can’t cheat.

BeInMedia (Nmo AI), Kuwait • Dubai • Doha.
Mulham Fetna
Author
Mulham Fetna
Renaissance Engineer
Trading Strategy Finder - This article is part of a series.
Part 5: This Article

Related

Our track record can't cheat. Here's how we froze it

Every trading track record you’ve ever seen asks you to trust its author about one thing: that the rules weren’t adjusted along the way. Strategies quietly swapped after a bad month, windows chosen after the fact, losers left out of the tally. You can’t audit any of it, so the record is worth exactly as much as the author’s word. For the final act of this project, we built a track record where the author’s word doesn’t matter. Out-of-sample by construction # On 2026-08-31 we signed a protocol — a public document in the repository — that froze everything an author could later fudge: The universe: exactly 9 of our 54 configurations, admitted by five pre-registered criteria applied to the forward books (the selection beat a random-set control — claim LIVE-ALLOWLIST-FROZEN). Not one slot was hand-picked. The parameters: the deployed set, pinned by cryptographic hash into the signed document. The replay tooling refuses to run if the universe file differs by one byte from the signed hash. The rules: one contract always, the engine’s stated fill conventions, mechanical kill rules, and a “never-list” (no manual overrides, no window cherry-picking, no pausing to wait out a drawdown) — violations void the record’s claims from that point, by the protocol’s own text. flowchart LR P["✍️ signed protocol 2026-08-31, public in the repo"] --> U["THE UNIVERSE 9 of 54 configurations, admitted by five pre-registered criteria (beat a random-set control)"] P --> PAR["THE PARAMETERS pinned by cryptographic hash — replay refuses to run on a one-byte difference"] P --> RU["THE RULES 1 contract · stated fills · mechanical kills · never-list (violations void the record)"] Because the parameters and universe were published before any future data existed, every recorded window is out-of-sample by construction. When new data arrives, it is first audited against the previous delivery for retroactive changes (a repaint check), then replayed with the frozen set. The result becomes a new claim in the machine-verified ledger — a losing window under exactly the same rules and prominence as a winning one. The protocol says so in writing: a negative outcome is a publishable result of the protocol, not a failure of it. No verdict is allowed before a pre-registered power threshold; interim windows are descriptive only.

What 16 years of data and 3.5 months of honest testing taught us about trading strategies

This is the story of a research project my team at BeInMedia ran from May to September 2026: a systematic attempt to find out what actually survives in futures trading once you stop fooling yourself. We built the machinery, paid for the answers, and published everything — including the failures. The code, the evidence, and every number below are public and machine-verifiable: github.com/mulhamfetna/trading-strategy-finder. Here is the whole arc, honestly told. flowchart LR A["May 2026 machinery built: backtest engine · optimizer · claims ledger"] --> B["Jun–Aug 2026 the studies: economic-calendar sweep · 225-cell ORB grid · forward test of our own fleet"] B --> C["Aug 31, 2026 track record frozen under a signed protocol"] C --> D["Sep 2026 two preprints filed · everything published, including the failures"] The rule that shaped everything # Backtests lie — not because the math is wrong, but because the person running them chooses what to try, what costs to assume, and what to show you. Our defense was structural: every study was pre-registered before it ran (design, thresholds, controls frozen in writing first), every negative result had to prove it had the statistical power to see an effect, every positive had to beat a dumb control, and every published number lives in a machine-verified claims ledger — re-derived from committed evidence files by our CI on every change, 79 claims and counting. If a number in this series doesn’t re-derive, our own build fails.

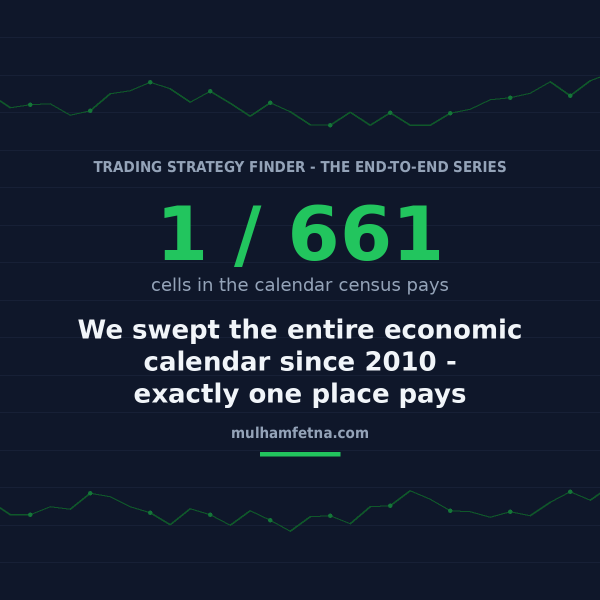
We swept the entire economic calendar since 2010. Exactly one place pays

Scheduled economic news — inflation prints, jobs reports, rate decisions, oil inventories — moves futures markets violently. Every trading course says so, and it’s true. We wanted the question nobody answers with a complete sample: which of these moves can you actually get paid for, after real costs? So we tested all of it. Not the promising ones — all of it. The sweep # Three waves, each pre-registered before running: first 612 market×news pairs on nine futures markets against the full calendar since 2010; then the secondary series (11,822 additional news moments); finally a literal closure census of all 661 remaining series×instrument cells, so that every combination in our registry has a recorded verdict — positive, negative-with-power, or honestly “underpowered, no verdict”. Costs stressed on every table. The answer: one place # The US CPI (inflation) release, on equity-index futures. That’s it. The market jumps on many things; it pays on this one: Long NQ (Nasdaq futures), entering 300 seconds before the release, fixed stop and target: +$133 per event net of stressed costs, t = 4.13 — and it survives a Bonferroni correction across all 54 cells of that study design. ES (S&P futures) riding CPI alone: 116 events, +$151.37 per event at $52.50 of stressed costs, p = 0.0027, the release jump 20.5× the quiet baseline, both sample halves positive, control floor and a 1,000-placebo noise check green. Recent regime (2024–2026): +$529 per event. The premium is ordered exactly by index sensitivity: Nasdaq > S&P > Dow > Russell. It is an equity-index phenomenon — the same event on gold or oil pays nothing. flowchart LR NQ["NQ · Nasdaq most index-sensitive largest premium"] --> ES["ES · S&P 500"] ES --> YM["YM · Dow"] YM --> RTY["RTY · Russell smallest premium"] RTY -.-> X["GC · CL · NG … same event, pays nothing"] The graveyard (equally important) # Of the 661-cell closing census, exactly one cell came out exploratory-positive. 179 cells are significant negatives — and here’s the instructive part: 41% of those lose purely to costs (their gross edge is within $5 of zero), and 29% are actually gross-positive before friction. The market really does move; the move really is bigger than quiet times; and the spread eats it. Violence is not premium.

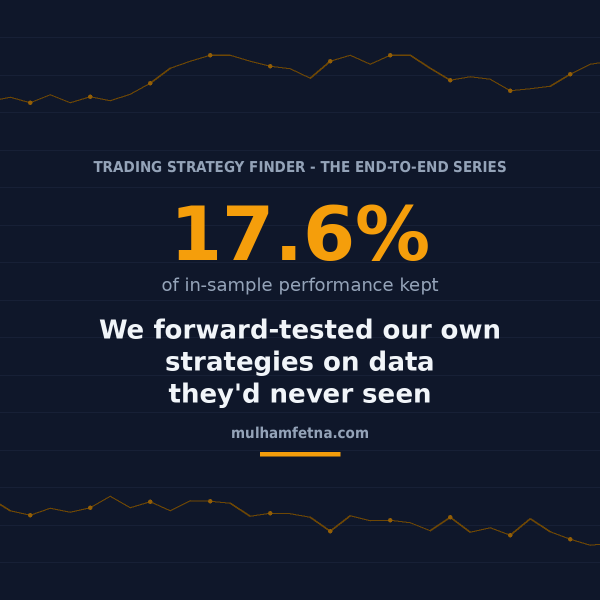
We forward-tested our own strategies on data they'd never seen. They kept 17.6%

Everyone forward-tests other people’s strategies. The uncomfortable experiment is doing it to your own — the 54 optimizer-selected configurations you actually believe in — on a window of the future that arrived after every parameter was fixed, with a falsifier written before the run. We did it twice (round two after a data correction — more on that below). Here’s what honest out-of-sample performance looks like. The headline table # 3,733 entirely new trades across all 54 configurations, nine futures markets: Fresh window, all 54 trades raw at $10/round-trip at $25/round-trip total 3,733 +$29,807 −$7,523 −$63,518 The raw positive is statistically indistinguishable from zero (t = 0.88). Against what the calibration window promised, the fleet kept 17.6% of its per-trade rate — a decay that is itself statistically significant (t = −2.53). The survivors of $25 costs are few and nameable: the 4-hour timeframe (+$10,106 net) and ES as an instrument (+$17,119). Fifteen of 54 configurations stayed positive at $25; most of the rest are small-timeframe cells whose $4–7 gross per trade is a commission illusion.

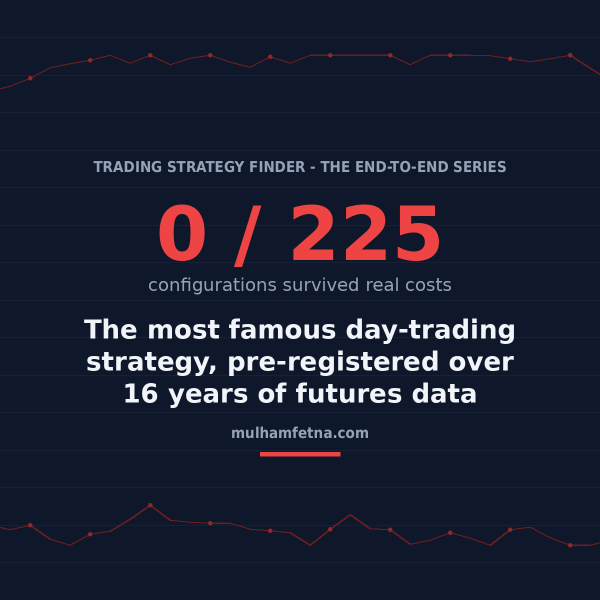
We tested the most famous day-trading strategy on 16 years of data. Zero of 225 versions survived real costs.

If you’ve ever watched a trading tutorial, you’ve met the opening-range breakout: mark the high and low of the first minutes of the session, and trade the breakout when price escapes that range. It’s simple, mechanical, and everywhere — and recent academic papers report spectacular returns for it on stocks. We wanted to know: does it actually work on futures — the markets we research — once you pay real-world trading costs? How we made it impossible to fool ourselves # The problem with backtests is that the person running them controls everything: which variants get tried, which costs get assumed, which results get shown. Try enough variants and something will always look great by accident. So before computing a single profit number, we pre-registered the entire experiment in our public repository: nine futures markets (Nasdaq, S&P, Russell, Dow, gold, silver, copper, crude oil, natural gas), two session anchors, four range lengths (5/15/30/60 minutes), three exit rules taken verbatim from the literature, plus a published comparator rule — 225 configurations, zero tunable parameters, verdict thresholds and controls fixed in advance. Sixteen years of one-minute data (2010–2026). One contract per trade. Costs stressed at $25 per round trip. No configuration could be added, removed, or “fixed” after seeing results.